
Unified Logging
The Zappl agent sends log output to Apple’s Unified Log. This offers a simple way of collecting and filtering through logs with a set category or from a set timeframe.
Streaming Logs
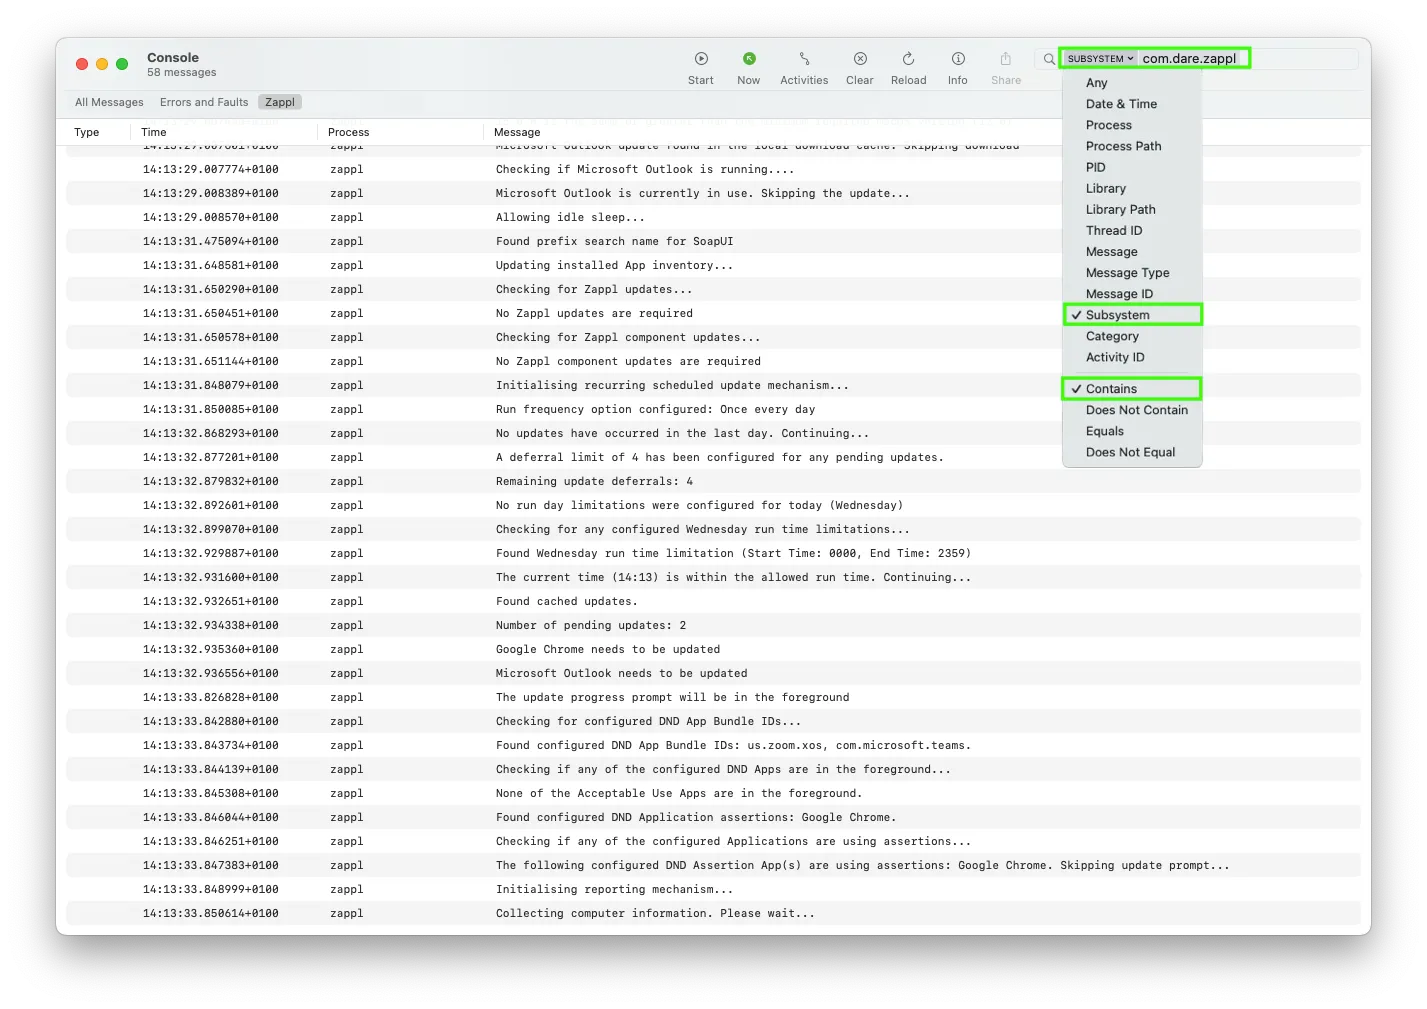
To stream all current Zappl logs with Terminal, launch Terminal and input the following command, then press enter.SUBSYSTEM and enter com.dare.zappl as the subsystem name.
Historical Logs
You can use the Terminal app to run any of the below commands to gather historical Zappl logs using Apple’s unified logging. Display all Zappl logs from the last $timeframeZappl Log File
This log stores the previous 4 weeks of historical information outputted by Zappl, from informational output to any errors and warnings encountered.
Text
Zappl Portal Logs
The Zappl agent sends any errors or warnings it generates to the device records in the Online Portal . These records are stored for 30 days, providing an easy way to view issues without sifting through the main Zappl logs. For more information, see Logs.Capturing Logs via MDM
Using an MDM tool like Jamf Pro (which will be used as an example below), we can capture Zappl logs remotely from a Mac, and upload to the relevant Inventory Record for download and further investigation.
Script
The script used for Log Collection can be found here.
API Client
1
In Jamf Pro, navigate to Settings > System > API Roles and Clients > API Roles
2
Create a new API Role, giving it a relevant name.
3
The only privileges needed for this workflow are 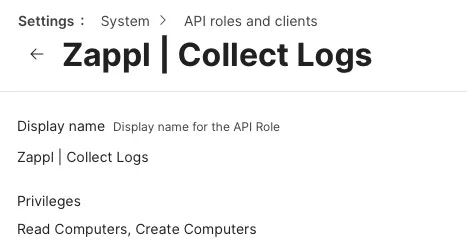
Read Computers and Create Computers. 4
Navigate to Settings > System > API Roles and Clients > API Clients.
5
Create a new API Client, giving it a relevant name.
6
Choose the API Role you created in the prior step.
7
Under the Enable/disable API Client option, click on Enable API Client. Upon clicking Save, this provides you with an option to Generate a Client Secret.
8
Clicking on this option presents a popup. Click on Create Secret and you will be provided with a 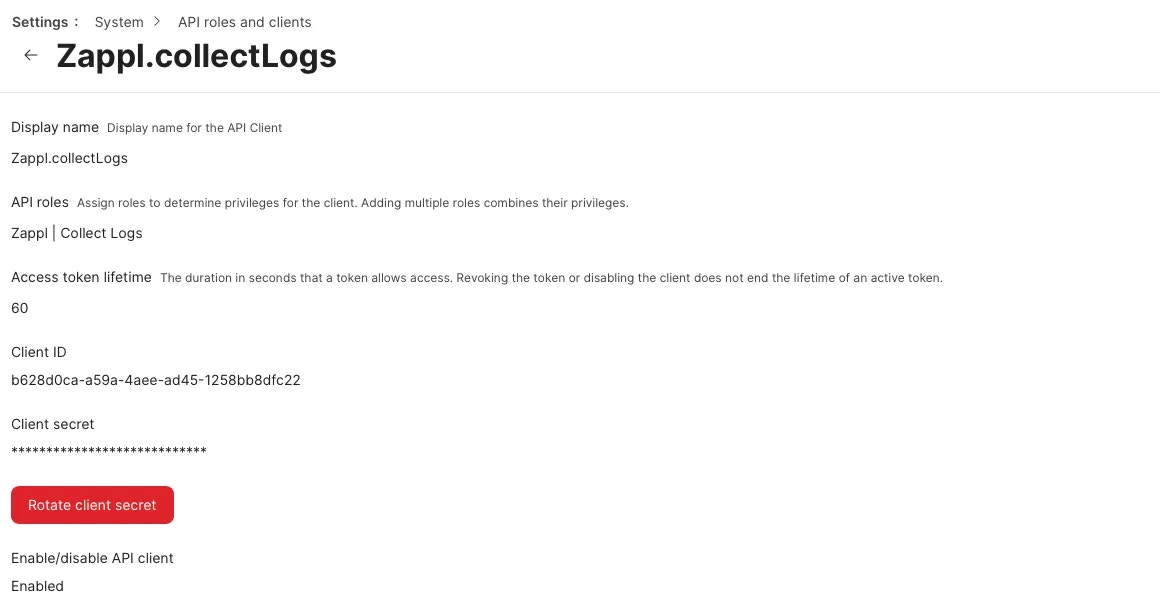
Client ID and Client Secret.Be sure to copy these details to your clipboard, as the Secret cannot be viewed again without rotating it. We will be using these details with our Collect Logs script in the next steps.
We’re now ready to utilise this API Client in a Jamf Pro Policy.
Policy
1
In Jamf Pro, navigate to Computers > Policies, and click on Create New.
2
Give your Policy a relevant name, and choose how you want the Policy to trigger.
3
Click on the Scripts payload and select the
Collect Logs script you should have uploaded earlier.4
Enter the necessary parameter details as follows;
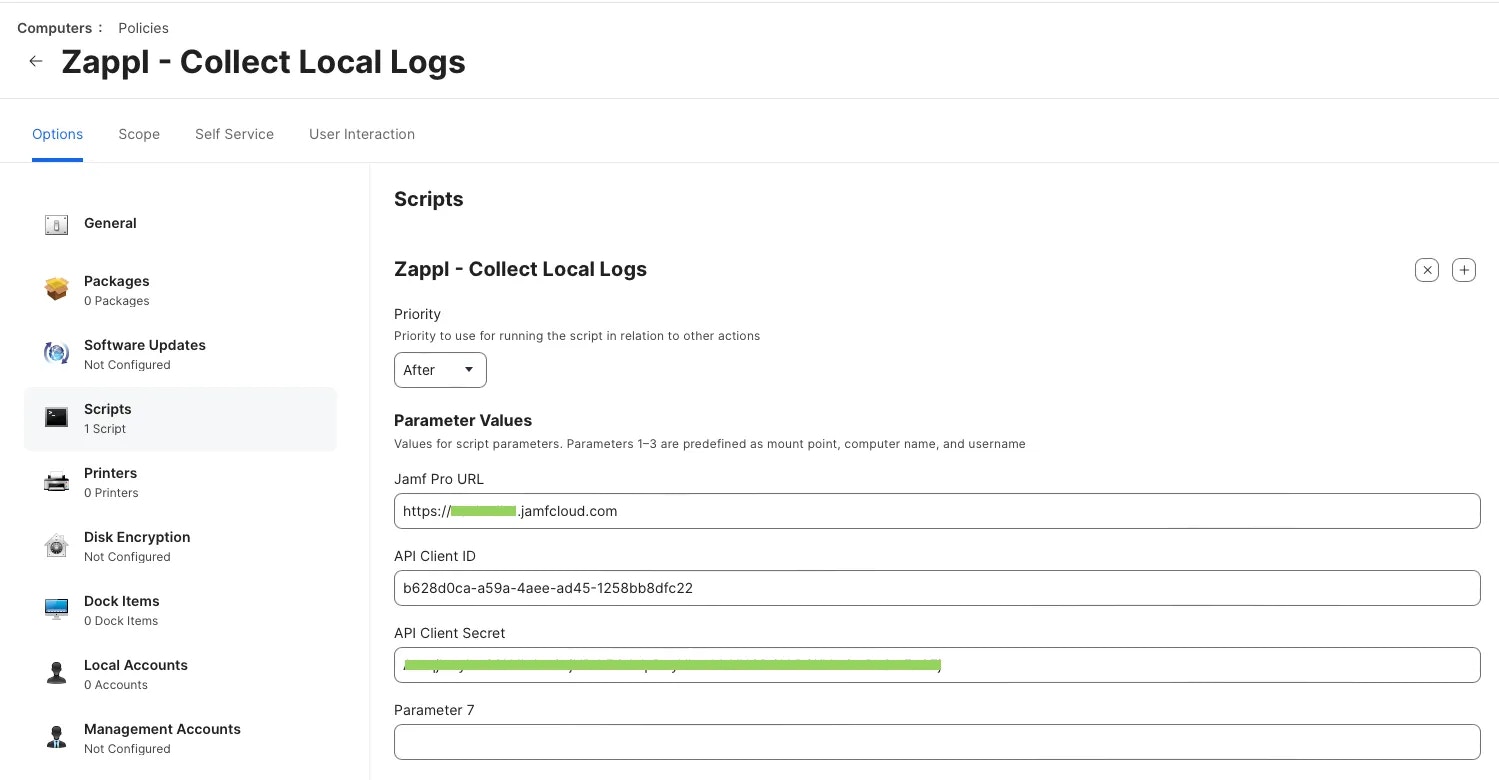
Parameter 4 | Jamf Pro URL
Parameter 4 | Jamf Pro URL
Parameter 5 | Client ID
Parameter 5 | Client ID
Copied from the earlier API Client steps.
Parameter 6 | Client Secret
Parameter 6 | Client Secret
Copied from the earlier API Client steps.
5
Set the Scope of the Policy to your preference, and Save the Policy.
Once the policy has executed on the target Computer(s), you can proceed.
6
Navigate to the relevant Inventory Record(s).From here, in the 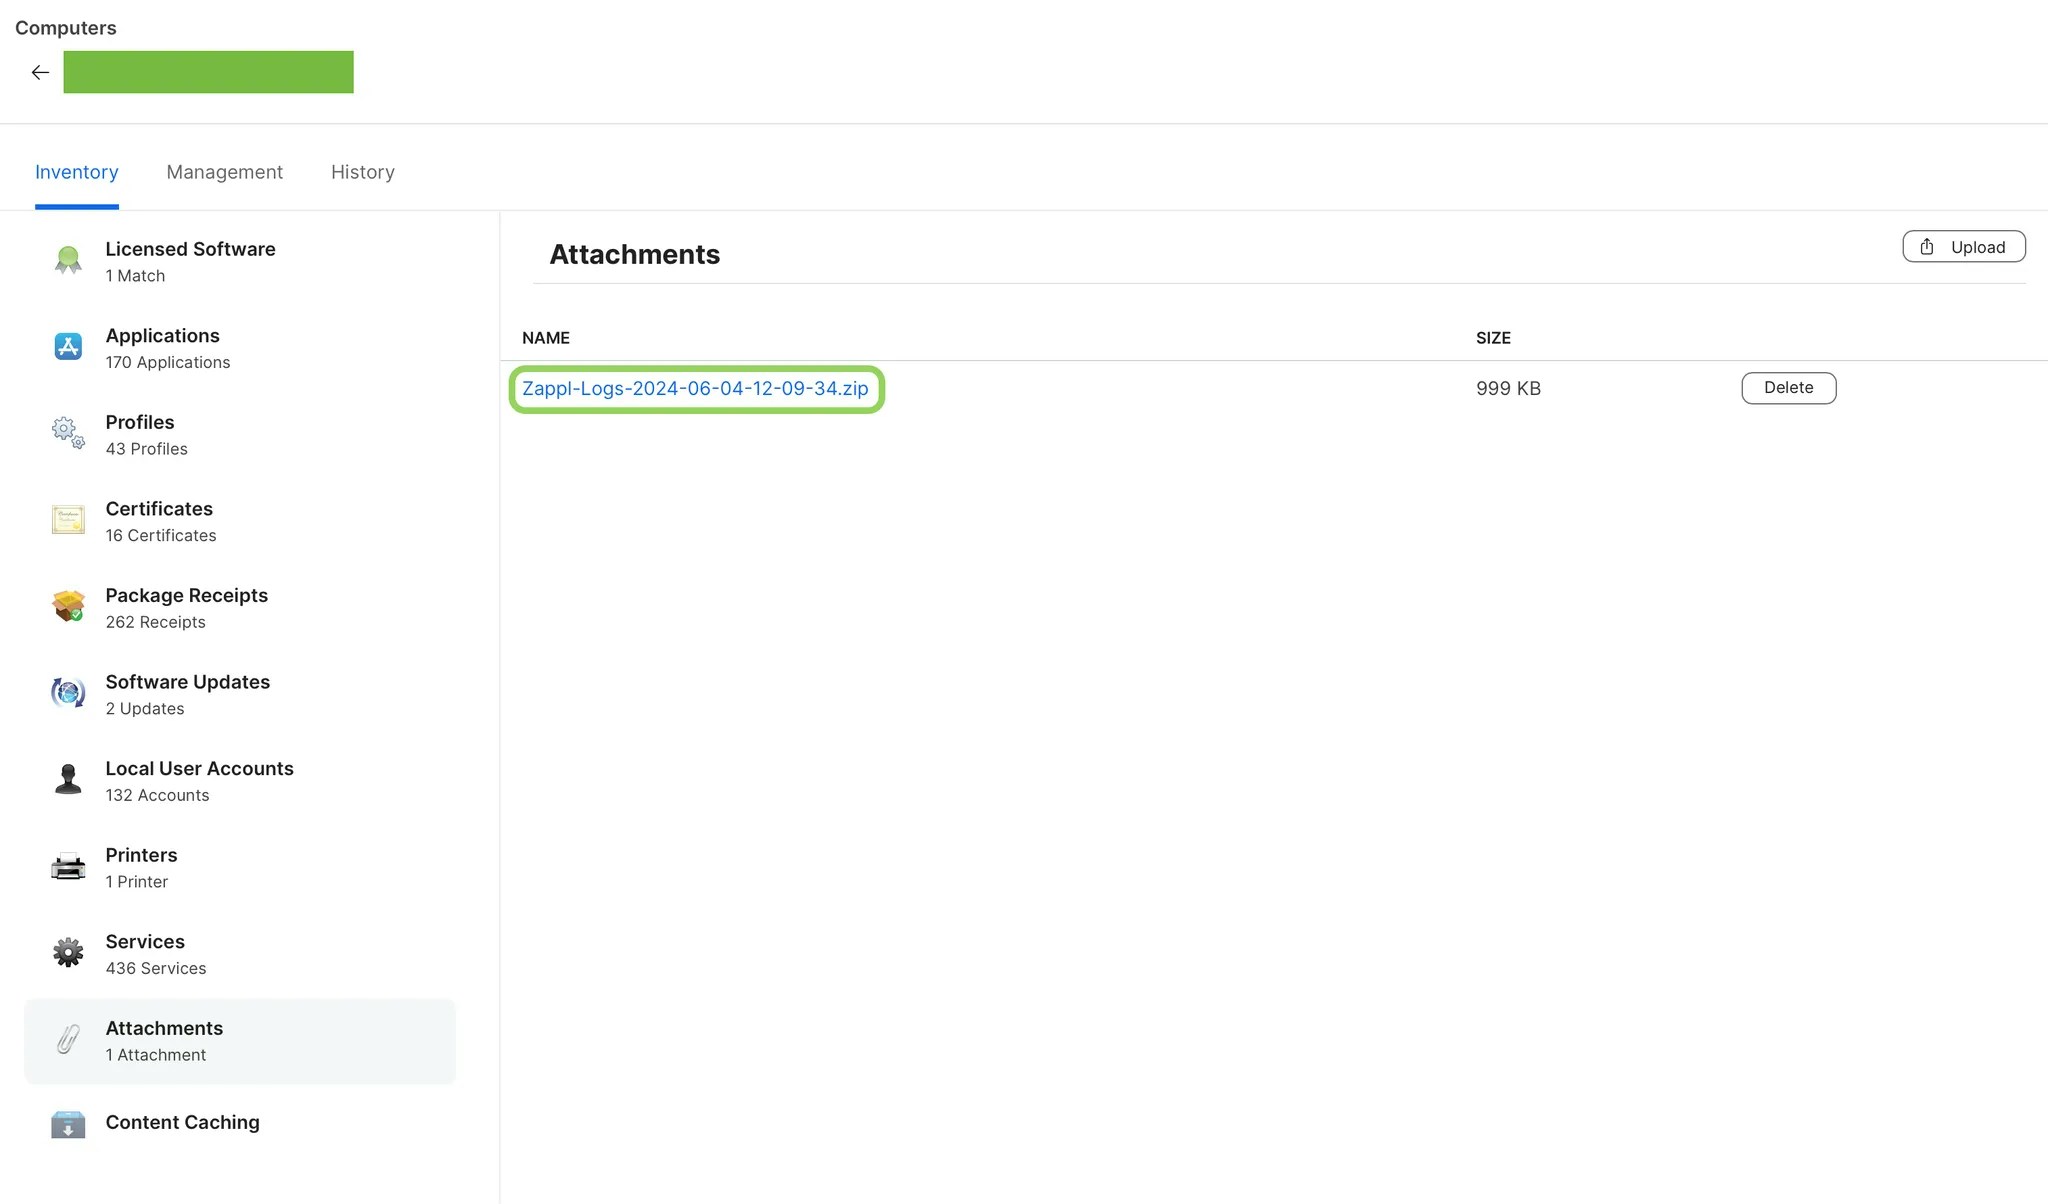
Inventory tab select the Attachments option, and you should see a Zappl Log uploaded. 7
You are then able to download this log to your own computer for further troubleshooting.